Earnings Explorer
Data exploration utility for corporate earnings data.
Goals
I had two goals for this project.
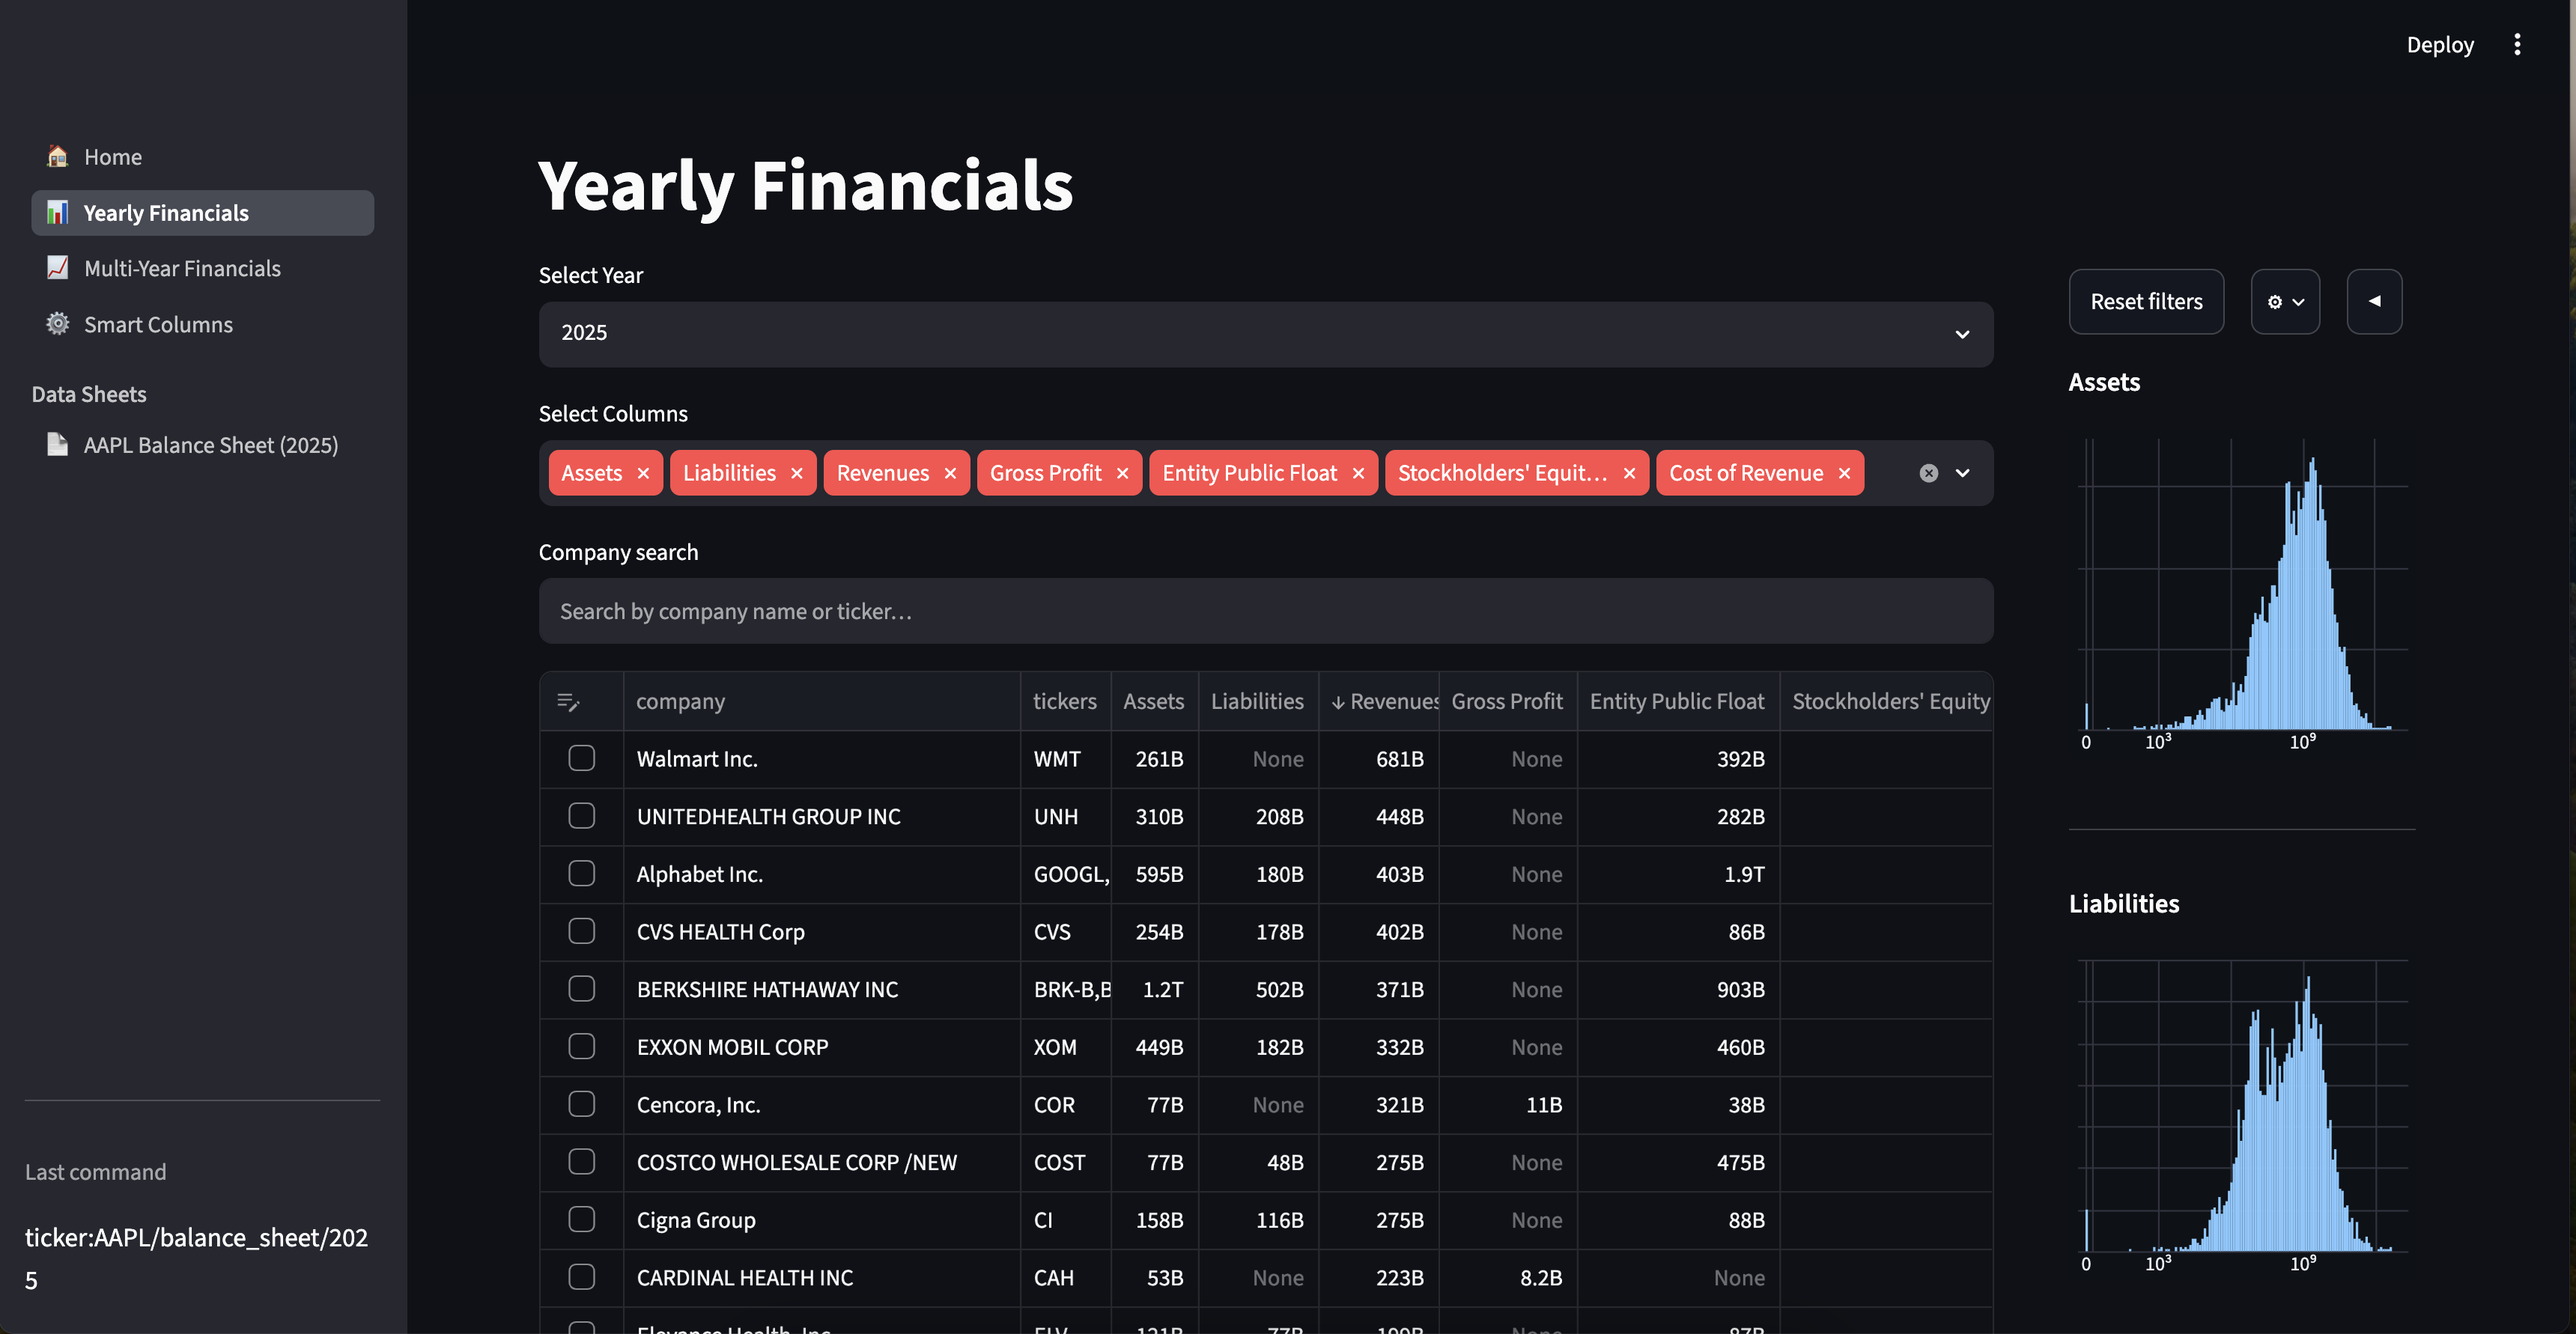
The product goal is to provide access to corporate financial data in a format that is just as accessible as a price chart. The is an answer to the observation that, when considering investments, people frequently seem to consult price charts first, and try to base their decisions on the movements of prices. Price movements are difficult to interpret because they reflect not only business performance, but also consensus beliefs and emotions in the market about the future. Earnings data, on the other hand, are more readily interpretable as an image of a company’s present state, and are thus useful to have just as readily available, and comparable across years and companies.
The technological goal is to give access to ground truth data about companies in a format that is usable, so the user can get as granular as they would like, while still being able to extract insights quickly. This contrasts with raw AI model outputs, which tend to be plausible, but are not guaranteed to be grounded or trace-able. The approach that I take here is to provide immediate access to ground truth data (although filtered through the edgartools library), both in table format and also in individual statements, with ‘smart’ data manipulations by translating queries into column manipulations. I originally planned to route these queries to an LLM model, which would construct the data manipulation expression, but, for the present purposes, it turns out that a small number (3) of specific manipulations is sufficient.
Technology
This project uses streamlit https://streamlit.io/ to render data exploration components from python code. It is currently running up against the limits of what streamlit can accomplish with its frequent re-renderings (for example, dataframes are re-rendered when rows are selected, resulting in sorting being lost). The data from the SEC edgar database is accessed using the python package edgartools, which provides concept annotations and a degree of standardization as well as nice renderings of individual statements. The search component uses the kbar javascript library.
Challenges
The main challenge that this project faced is the organization and messiness of the edgar data. The edgar data is organized according to reports filed by company and by year. This means that cross-company, cross-year comparisons necessitate a scrape of the database, which is not difficult, but I found it to be a fairly manual process. The edgar meta-data is messy, because, despite the gaap standards, which are used to standardize how quantities are reported, different companies report different versions of similar quantities, for example ‘Cost of Revenue’, ‘Cost of Goods Sold’, and ‘Cost of Goods and Services Sold’. The edgartools library helps somewhat in this regard, but I still ended up filtering out the majority of concepts, which are reported in less than 5% of filings each. In the end, this is resolved mostly by the design constraint that users must have access to the raw data, combined with a set of data-filling rules, which give good coverage of analyses on the data.
Discussion
It is often said that any sufficiently complex data tool contains a re-implementation of excel, a trap that I did not fully avoid in this project. I am fairly happy with the tool as is stands, but it did not end up using any AI calls, which was my goal at the outset: using language models to generate (polars) expressions that are used to manipulate / transform raw data. This is not necessary in the project as it stands, a good thing from the perspective of token economy. In that viewpoint, however, this project could be seen as a (fairly manually generated) version of what a ‘smart’ data interface should be able to output on the fly with minimal prompting. The user interfaces act as parameterized transformations of the raw data, and the final tables / plots as the output of the transformations. The absence of queries to an AI model shows the current application to be an asymptotically efficient output of the generation process: the token cost for operating the visualization is constant in the number of usages. These ideas are targets to explore more in the future.
Links
Source on github: https://github.com/lrast/earningsReports
Live version hosted on streamlit cloud.